
Using Satellite Data to Find Gamefish

New Zealand is the food larder for many pelagic species in the Western South Pacific. We have pelagics migrating here each year from the productive South Fiji Basin spawning grounds as well as southern bluefin tuna from the Timor Box spawning grounds. New Zealand is in the path of the nutrient-rich currents flushing up from Antarctica and has a steep bathymetric coastline, creating perfect feeding conditions to attract pelagic gamefish to our coastline.
“Find the bait, find the fish,” has always been the mantra for gamefishing, and we now have at our fingertips an incredible range of meteorological data to assist us in the search for the ideal feeding grounds.
When I first started longlining for tuna over two decades ago, the oceanographic information available was very limited. I would print out a rudimentary Sea Surface Temperature (SST) chart from my home computer which was often two or three days old, and I would head out to the most likely patch of water in my region. It was not very accurate, but it gave me a place to start.
Nowadays, as a long-time ambassador for TIMEZERO and Furuno, I have an incredible wealth of information available to me onboard the vessel – and it’s constantly updated.
At the start of a tuna trip, I will first look at the sea surface height (SSH) anomalies. This tells me where the upwellings are forming and the associated currents. By identifying the upwelling and downwelling areas, I can locate the convergence zones where marine life will be concentrated.
I next look at the SST chart and locate areas of temperature shear (changes in temperature over short distances) that converge with areas of opposing currents or eddies. With the TIMEZERO Navigation Software, I use the SST image and overlay other data onto the image to get a complete picture of what’s going on out there. I call it “ticking the boxes”. The more boxes you have ticked in a certain area, the more likely it is you will find your target species.
Once I have the SST up on the screen, I overlay the chlorophyll data as a colored front, and I then bring in the currents as arrows; the bigger the arrow, the stronger the current. Finally, I overlay the SSH as contour lines. I now have an SST image that also shows the chlorophyll concentrations, where the currents are trapping those concentrations, and the areas that are converging with temperature fronts.
Sea surface temperature (SST)
SST charts are a key tool for finding the most productive areas where the food chain begins to form. Water temperature dictates fish behaviour. Being cold-blooded, fish seek out the temperature zones where they feel most comfortable, and when fish come across an area where the temperature suddenly changes, they gather in big numbers.
Using SST charts helps you identify the temperature fronts that act as a natural barrier between warm and cold waters. The thermal fronts are where the upwellings – carrying large quantities of nutrients – merge with the warmer water, offering ideal conditions for the growth of phytoplankton, which attracts small baitfish and microorganisms, kicking off the localised food chain. Baitfish gather in these areas, which attract the pelagic species you are targeting. To optimise your chances, target the edges of these fronts where the water becomes clearer and warmer.
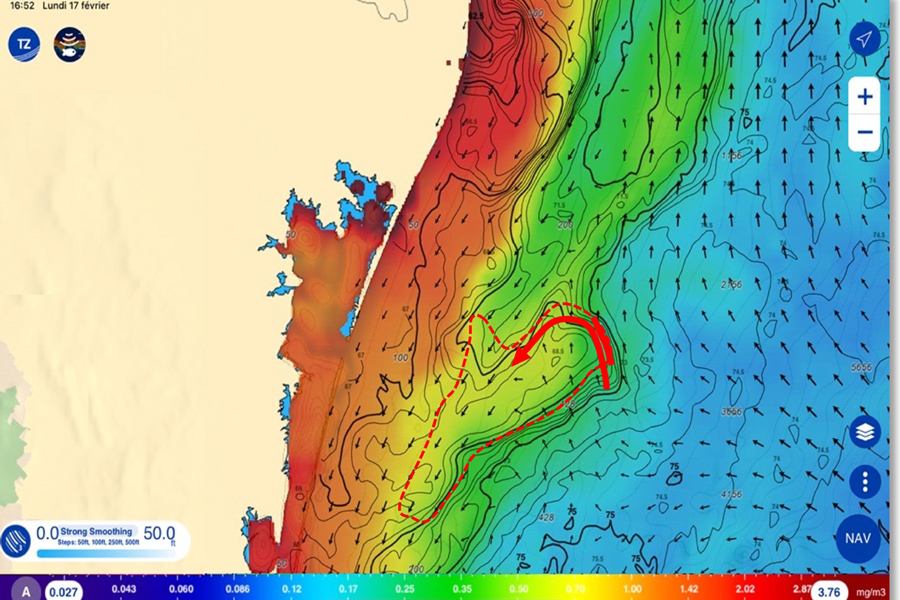
By cross-referencing different types of data, you can pinpoint areas of high marine productivity. This chart shows chlorophyll as colours, the SST as contours, and the currents as arrow overlays.
With the SST charts, you can look for the eddies where a section of water juts out from the main body and produces a high concentration of bait in a tight area – the cold water surrounding the eddy acts as a barrier that the baitfish won’t cross. Gamefish species cruise around the outskirts of these areas, dashing in to feed on the bait before leaving the eddy to rest in clearer water. Ocean eddies trap chlorophyll at the surface and maintain ideal conditions for microorganisms and, in turn, bait to concentrate in a small area.
There’s a close relationship between SST and chlorophyll concentration; cold waters are generally richer in nutrients as they often originate from nutrient-rich, deepwater upwellings. This richness favours the growth of phytoplankton, which contains chlorophyll, resulting in high biological productivity.
When looking at your SST chart, warmer areas are typically indicated by red colours, dropping down to blue colours for the colder areas. You are looking for areas where there is a sharp change from red to blue; these are your convergence zones where the magic happens.
Chlorophyll
In sportfishing, many factors influence the success of a trip: water temperature, currents, presence of prey, etc. But one key indicator is often overlooked: chlorophyll concentrations.
Chlorophyll is a key biological marker for identifying areas of high marine productivity. It plays a fundamental role in the food chain, enabling phytoplankton to capture light energy for photosynthesis. Chlorophyll-rich phytoplankton are consumed by zooplankton, which in turn are eaten by baitfish.
In the open ocean, light generally penetrates to a depth of 200 metres – this is the zone corresponding to the habitat of most species targeted by gamefishers.
A chlorophyll front is a clear transition zone between water masses with different biological and physical characteristics, notably between clear, nutrient-poor waters and turbid, phytoplankton-rich waters. These zones are ecologically rich, favouring high biological productivity and attracting numerous marine species to create biodiversity hotspots. These are visible from satellites thanks to their chlorophyll concentration, and they vary with the seasons and currents. For fish, these fronts act as natural barriers where they accumulate, making them important fishing grounds.
Even though satellite images reveal chlorophyll concentrations, interpreting them requires care. Water with low concentrations is typically very clear, contains minimal nutrients, and supports limited marine life. Moderate concentrations offer a balance between clarity and the presence of phytoplankton, and are best suited for attracting bait concentrations as they favour both clear visibility and high marine productivity. Areas with very high concentrations of chlorophyll are very rich in phytoplankton but offer limited visibility and depleted oxygen, making them unsuitable for most species.
Long relegated to second place in marine data analysis, chlorophyll is now a key indicator for gamefishers. Thanks to satellite imagery and tools that improve its interpretation, it is now possible to pinpoint areas of high marine productivity – in other words, fish magnets. By cross-referencing chlorophyll data with surface temperature, ocean currents and sea level, we can gain a detailed understanding of undersea ecosystems, and hence a more effective fishing strategy.
Sea surface height (SSH)
The ocean’s surface is not flat. It’s made up of bumps and troughs just a few millimetres deep. These small variations in height have a major impact on the dynamism of the oceans and the distribution of living creatures in the water.
SSH, or altimetry, gives us information on the height of the water by comparing it to the geoid (mean sea level). It is measured by satellite altimetry (i.e., the distance between the satellite and the ocean).
When studying altimetry in oceanography, we distinguish two main zones: upwellings and downwellings.
Upwellings are areas where cold, nutrient-rich water rises from the depths to the ocean surface. This often occurs close to the coast and attracts many fish, as the nutrients feed the plankton that forms the basis of the food chain.
Downwelling zones, on the other hand, are areas where the surface waters, often warmer, sink to the depths. This happens when wind pushes surface water towards the coast, or when currents meet. This brings oxygen to the depths, but is less favourable for fishing, as fewer nutrients rise to the surface.
SSH is the first information I download as it gives me an overview of the whole area, helping identify major ocean structures. While the SSH anomalies themselves do not necessarily indicate the best fishing areas, the convergence zones where two opposing upwellings and downwellings meet will attract fish. At the edges of the opposing anomalies, you will find the eddies, which are my favourite areas to fish.
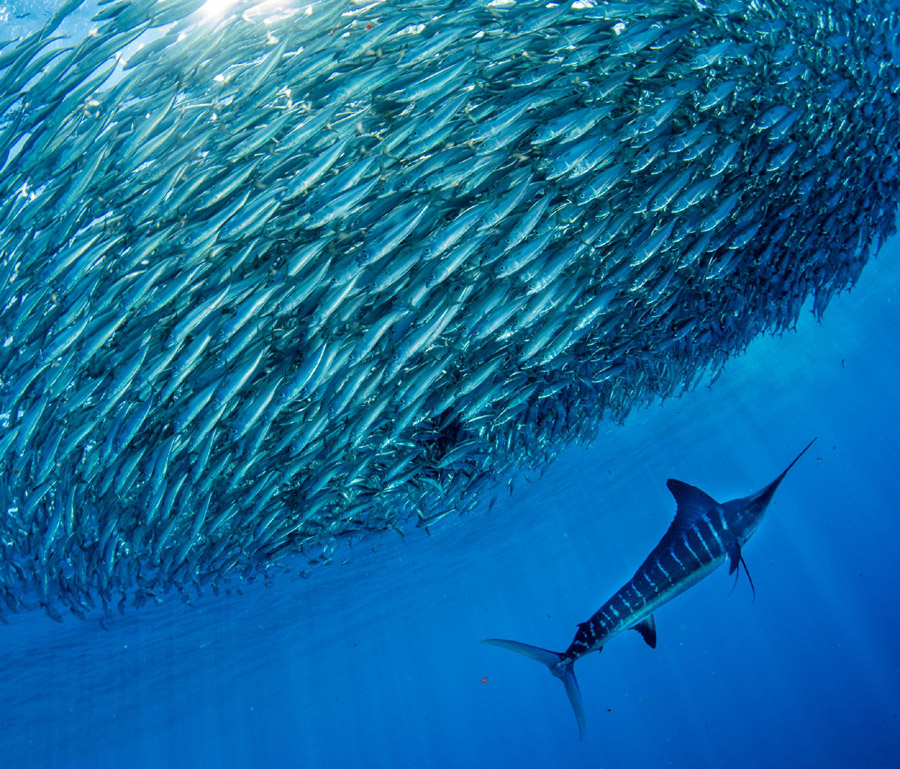
Where favourable SSH, SST, currents, and chlorophyll conditions merge is where you will find the baitfish, and with them the large, pelagic species.
In the depths of the ocean, the water is dark and cold. There, nutrients accumulate in large volumes. When the wind pushes the warm surface water out to sea, it creates an opening, rather like a natural elevator, allowing the cold, nutrient-rich bottom water to rise gently to the surface. These phenomena are called upwellings, and the edges of upwellings are where I target when shooting commercial longlines.
Once at the surface, this water meets the sun’s rays and everything speeds up! Phytoplankton multiply rapidly, like grass after a good rain. It then becomes a feast for zooplankton, the tiny animals that rise and fall in the water column over the course of 24 hours in the diel vertical migration. Attracted by the abundance of food, baitfish flock to the area, closely followed by big fish such as tuna. This upwelling of cold water awakens a whole chain of marine life.
Upwellings can be strongly influenced by underwater topography, particularly in areas where a continental shelf precedes a steep slope to the deep water. Areas like East Cape and North Cape are classic examples of this.
Using the TIMEZERO Ocean-O premium weather service, when I bring up the SSH image on my screen, I have it configured so the SSH information appears as concentric zones where SSH values are lower than those in the surrounding area. I can then overlay chlorophyll and phytoplankton concentrations on the image to help narrow down the areas where there will be the highest productivity.
Ticking the boxes
Now that the latest data has been uploaded, it’s time to tick the boxes. The more favourable meteorological events you can find in one area, the better your chance of finding your target species. You have looked at SSH, SST, currents, and chlorophyll concentrations and identified where these conditions are looking favourable. Where these favourable conditions merge is where you will find the baitfish, and with them the large, pelagic species. If you can find one or more of these factors that occur over a significant bottom structure, you now have another box ticked.
Once you have narrowed down your hotspots for the day, it’s time to load the GPS marks into your chartplotter and head out there to target your pelagic species. Once you arrive at a potential hotspot, you should employ the traditional techniques that were used before satellite data was available to find the action. Your satellite data has put you in the vicinity of the most productive area, but you cannot beat using your eyes to find the action. Visually scan the water, looking for birds and dolphins feeding, tidal shears on the surface, oil slicks from recent feeding action, colour changes, current lines, and, of course, bust-ups of baitfish on the surface.
TK thanks his brand partner TIMEZERO for supplying imagery and technical advice.
The Offshore Crew

Tony draws on over two decades of commercial pelagic longlining experience.
I have spent a lifetime working offshore targeting gamefish, both recreationally and as a charter skipper and commercial tuna longline fisher. Having worked in the Pacific and Southern oceans, the Tasman, Coral and Timor seas, I have fished through every imaginable scenario and have a fair idea of what to look for when targeting pelagic species (and what to steer clear of).
Meteorological data can be incredibly daunting and complex to the untrained fisher – with that in mind, I set up The Offshore Crew subscription site for fishers wanting updates twice a week, where I upload images and hotspots for anglers to target. This takes the guesswork out of it for our members, and we share information on what’s happening out on the grounds on any given day.
Our anglers are having great success with the information we’re sharing, including tournament wins, as well as sharing information with each other for everyone’s benefit.
If you would like to join our friendly fish-focused community and have the latest hotspot information available twice a week from a veteran fisher, you can check us out on www.theoffshorecrew.online
- By Tony 'TK' Walker
Fishing Reports Visit Reports
Bream Bay Fishing Report - 29/10/26
'Softly softly' approach to workups. Now is the time most inshore snapper fishers dream of... Read More >
Rotorua Fishing Report - 29/10/26
Fantastic fishing set to only get better! The fishing around the Rotorua region has been... Read More >
Eastern Coromandel Fishing Report - 29/10/26
Kingfish, snapper and crayfish on the menu. The anticipation is building as we find ourselves... Read More >
Tauranga Fishing Report - 29/10/26
Fishing and diving heating up. Let’s start on a positive note this week, as water... Read More >



Monday 2 November 2026
Major Bites
 -
 -
Minor Bites
 - -
Tuesday 3 November 2026
Major Bites
- - Minor Bites
- -
Comments