Sea Surface Temp charts
Printed From: The Fishing Website
Category: Saltwater Fishing
Forum Name: The Work-Up
Forum Description: Game fishing related topics here
URL: https://www.fishing.net.nz/forum/forum_posts.asp?TID=137359
Printed Date: 02 Nov 2026 at 3:12am
Topic: Sea Surface Temp charts
Posted By: yellafin
Subject: Sea Surface Temp charts
Date Posted: 22 Dec 2022 at 5:08pm
|
Hoping for some help. I used to use the SST info on Swellmap to get a rough idea of what the temp was doing and where. Now that info seems to have dropped off their website. There was a member on here providing a service, but I can't seem to track him down. Any Advice would be appreciated.
|
Replies:
Posted By: yknot
Date Posted: 22 Dec 2022 at 5:51pm
|
Here you go oceaneyeq.com Paul will sort you out, and is is still contributor to forum. ------------- Those that say it can't be done are being overtaken by those doing it. |
Posted By: Alan L
Date Posted: 22 Dec 2022 at 6:46pm
|
Yes it is frustrating. But I have just noticed that Swell Map has it listed - near the bottom. Seemed a bit weird number for where I am but hope to check it out in next day or so.
Alan ------------- Legasea Legend member |
Posted By: yellafin
Date Posted: 23 Dec 2022 at 7:38am
| Thanks. I will check them out |
Posted By: Alan L
Date Posted: 23 Dec 2022 at 12:40pm
|
I just checked ydays quoted SST from Swell map against what it is reading in real time today - and it was correct. About 2-3 weeks ago we had 14.5 deg. Then last week 17 deg. Amazing. Then Swell Map yday tells me 19.8. So I didn't believe it. But that is what my transducer told me this morning also - 19,8. Alan
------------- Legasea Legend member |
Posted By: yellafin
Date Posted: 23 Dec 2022 at 3:43pm
|
Alan, I had a look at Swellmap and found the info you were talking about. It's a pity they don't show the temp break lines like they used too. It's free so I suppose you can't ask for much.
|
Posted By: Alan L
Date Posted: 23 Dec 2022 at 5:47pm
|
There is this one as well - showing all contours - and importantly, currents. I just wish they would make the colour scheme more useful. But it is free. But it would not cost more to change the colour scheme. Alan https://www.metservice.com/maps-radar/marine/sea-surface-temperature" rel="nofollow - https://www.metservice.com/maps-radar/marine/sea-surface-temperature ------------- Legasea Legend member |
Posted By: FishingMaps
Date Posted: 24 Dec 2022 at 8:49am
|
Hi I'm developing a fishing maps app for Avenza < http://store.avenza.com/index.html" rel="nofollow - https://store.avenza.com/index.html > that will provide SST maps like this < http://u.pc.cd/pem" rel="nofollow - http://u.pc.cd/pem >. Which areas of New Zealand are you interested in? If you send me lat/lon ranges I can make a map for that region. Also, someone mentioned the colours of SST maps. What sort of colours would be best for fishers? My maps will be free initially, but after that they can be downloaded on a single map cost basis. No subscription cost, just get a map when you need one.
Best fishes, Sam |
Posted By: Alan L
Date Posted: 24 Dec 2022 at 2:51pm
|
Hi Sam, the problem with the colour scheme in the above link is the gradation of the colour scale and trying to relate that to the chart temps. They need to be clearer delineations at the temp breaks. Different colours rather than different shades would help a lot. Regards Alan ------------- Legasea Legend member |
Posted By: MB
Date Posted: 24 Dec 2022 at 3:32pm
| FishTrack on mobile devices is free and reasonably up-to-date. |
Posted By: Alan L
Date Posted: 25 Dec 2022 at 6:57am
|
I think that is what I tried on my lap top and didn't work. But then most people use mobile phones these days. Just not me. Alan
------------- Legasea Legend member |
Posted By: FishingMaps
Date Posted: 25 Dec 2022 at 7:17pm
|
Alan Following up on your suggestions, how do these SST maps look? Which one do you think would be most useful to fishers? 1. Rainbow: http://u.pc.cd/HTIrtalK" rel="nofollow - http://u.pc.cd/HTIrtalK 2. Dense: http://u.pc.cd/FRvrtalK" rel="nofollow - http://u.pc.cd/FRvrtalK 3. Ice: http://u.pc.cd/SEGitalK" rel="nofollow - http://u.pc.cd/SEGitalK Sam
|
Posted By: Alan L
Date Posted: 26 Dec 2022 at 6:36am
|
Sam, They are all quite readable - but the first version looks ideal. Regards Alan ------------- Legasea Legend member |
Posted By: smudge
Date Posted: 27 Dec 2022 at 10:48am
|
Yeah the Rainbow is easiest to read ------------- Best gurnard fisherman in my street |
Posted By: FishingMaps
Date Posted: 30 Dec 2022 at 9:43am
|
My SST/ bathymetry maps on the offline Avenza map app are now ready for use. Please use this link for information on how to find my SST/ bathymetry maps https://support.avenzamaps.com/hc/en-us/articles/5050479283220-Getting-Maps-from-the-Map-Store" rel="nofollow - https://support.avenzamaps.com/hc/en-us/articles/5050479283220-Getting-Maps-from-the-Map-Store Once you are in the Avenza map store using the Avenza app on your cell phone, just search for sst using the keyword tab (not the location tab). Then you can purchase the maps (they are free at the moment). Feedback would be appreciated. Best fishes Sam
|

Posted By: Alan L
Date Posted: 30 Dec 2022 at 11:58am
|
Wow - that looks great Sam Alan
------------- Legasea Legend member |
Posted By: FishingMaps
Date Posted: 30 Dec 2022 at 12:48pm
|
Did you try it on the app, Alan? I recall that you said most people use cell phones for their SST but you don't? The thing is, if you use the app on your cell with navigation enabled (or on a tablet with GPS) you can see your boat position on my maps as you move, because these maps are geolocated and projected. The app provides some cool functionality, like being able to set a couple of way points and measure the distance between them. For example, you might be sitting at the jetty and wondering if you can make that warm tongue of water on the 300 metre contour, and get back by dinner time. So you set 2 waypoints on the map, measure the distance between them, and you can estimate travel time. No more messing around with rough estimates or trying to get your map integrated with your plotter. You can also drop a point where you caught fish, and it will be saved in the layers. Or you can search for a location (use the magnifier icon), and the app interacts with Google maps to find that location, which can be saved as a layer. Best of all, the maps can be used offline, when you don't have cell service but the GPS still works with the maps.
|
Posted By: Alan L
Date Posted: 30 Dec 2022 at 3:21pm
|
That sounds brilliant - but I dont have internet on my phone. Hardly use it. But the system looks like it will be very useful. I am sure others will pick up on it and provide some feedback. Regards Alan
------------- Legasea Legend member |
Posted By: SaltyC
Date Posted: 30 Dec 2022 at 3:29pm
| Great stuff, look at that 22 degree water at the 200m mark off the 9 Pin and 21 right into 100m mark at Cape Brett. No wonder we are hearing multiple marlin sightings/shots and yellowfin caught at the moment |
Posted By: Tzer
Date Posted: 30 Dec 2022 at 7:15pm
|
I would be interested to try this but I hate apps or working with apps. Any reason why this is not a web based program |
Posted By: Crochet Cast
Date Posted: 30 Dec 2022 at 7:42pm
 This is the sea temp from windy. The resolution is quite low but the colour scheme works. |
Posted By: FishingMaps
Date Posted: 30 Dec 2022 at 9:16pm
|
Avenza maps is a mobile application and can't be downloaded onto laptops and computers. It can be used on smart phones or tablets with GPS. It is desiogned to be an offline application that will continue to work when there is no Internet connection (which is pretty common in many areas where people fish). It's really pretty similar to the car navigation systems provided by Google Maps or Waze. We could still use paper maps (and fight with the wife over the route), or we can use an electronic guidance system. Avenza provides a navigation system for any map that has been geolocated. In my case, you use Avenza maps to navigate on an SST map to get you to the destination where you want to fish. Much like a car navigation system, you can measure the distance to destination, and calculate your ETA.
|
Posted By: FishingMaps
Date Posted: 30 Dec 2022 at 9:24pm
Here is my latest SST/ bathymetry map for the Bay of Plenty. If people have particular areas they are interested in, please let me know by sending lat/lon boundaries for the map limits). |
Posted By: Fish Addict
Date Posted: 30 Dec 2022 at 10:25pm
| Hi Sam, your SST & bathy maps have caught my eye. I now reside in Western Australia after living my first 30 years in NZ. During the latter part of 2022 I spent 3 weeks in Vanuatu. SST and bathy maps of that area would be of interest. Here are some boundary coords: Lats 17.20.000; 17.47.000. Longs 168.00.000; 168.36.000. |
Posted By: FishingMaps
Date Posted: 31 Dec 2022 at 8:49am
|
Hello Fish Addict There isn't much of a temperature gradient in Vanuatu, so I guess the complex bathymetry is of more interest. The areas you gave me were a bit small, so I increased them to -18.0, -16.5,167.5, 169.0. I'll upload this map to Avenza, but it takes them about a day to check maps before they appear on the app. I notice that there are people who won't use the Avenza offline navigation app for various reasons, so I'll produce duplicate maps with lat/lon axes and grids that can just be printed from a browser. I'll have to figure out a few things, but they will happen. 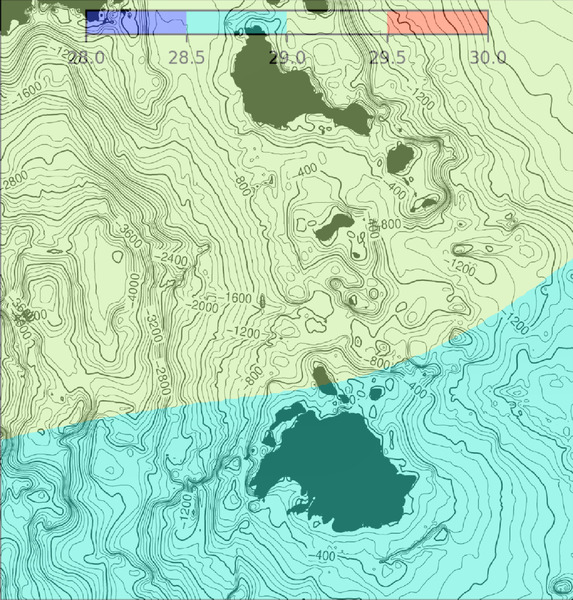 |
Posted By: Tzer
Date Posted: 31 Dec 2022 at 11:43am
|
Hi Sam how much more detail can you add to these maps. This is what Ripcharts looks like showing currents, can also do chlorophyll concentrations.  |
Posted By: FishingMaps
Date Posted: 31 Dec 2022 at 1:51pm
|
Hi Tzer I think the next step is to do a new chart that overlays current vectors (the arrows) on Sea Surface Height. Air pressure, water density and bathymtery all affect sea surface height, and the net effect is to drive current flows. These are the geostrophic currents which is what those arrows show. Overlaid on the geostrophic flows are the wind-driven or Ekman currents. Embedded in this complexity are the small scale convergences and divergences that arise from fronts. The fronts are created by density gradients, which are caused by temperature and salinity differences. The most relevant currents for game fishing are the currents along the fronts, which is not shown by the Rip Chart arrows.
|